

Cloud Security and Compliance Concerns and how to Overcome Them

Microsoft Azure is a public cloud computing platform that offers a wide range of cloud services for analytics, storage, computing, and networking.
Its massive success is reflected by the fact that revenue from Microsoft Azure grew exponentially over the last couple of years. This exponential growth is mainly because the platform offers a wide range of innovative abd productive solutions to solve everyday business problems.
While there are many cloud computing platforms, none are as effective at fulfilling business needs for integrated cloud solutions as Microsoft Azure. Azure offers an array of infrastructure and application services to help your organization overcome common challenges and meet performance and productivity goals.
Here are a few problems that you can solve with Azure:
Compliance Concerns
Insurance services, credit card data, and health-related information must be kept secure enough to meet the regulatory requirements for the Payment Card Industry (PCI) and Health Insurance Portability and Accountability Act (HIPAA) compliance.
Implementing these security standards can be challenging for businesses as they deal with the various factors necessary to maintain the highest levels of information security.
Azure and Mobiz can help.
Mobiz specializes in Azure cloud deployments, network automation, security and migrations. We have extensive certifications in all things Azure including Expert certifications.
PCI Compliance with Azure
When trying to ensure PCI compliance, you must ensure that:
- The application used to collect, store and process credit card data is compliant
- The infrastructure (network, servers, etc.) where the app operates and transmits information is compliant
While using Azure doesn’t automatically make the app compliant, the platform can help enhance the security of the infrastructure.
The PCI Data Security Standard (PCI DSS) governs the compliance needs of the infrastructure, covering components such as web servers, databases, routers, switches, firewalls, etc., along with any other element used to access cardholder data.
Azure is Level 1 compliant as per the PCI DSS standard. This means that when you host data in an Azure environment, there’s no need to worry about the networking or infrastructure aspects controlled by Azure.
HIPAA Compliance with Azure
Organizations are subject to HIPAA guidelines when collecting electronically protected health information from their clientele. Service providers must also supply written agreements and documentation that follow stringent security and privacy guidelines.
Microsoft facilitates HIPAA-compliant solutions via a contract addendum called a HIPAA Business Associate Agreement (BAA).
Mounting Security Challenges
Businesses are dealing with increasingly complicated cyber-attacks, hacks, data thefts, and other cybersecurity threats. This crisis will only get bigger with time, mandating the need to reinforce cyber defenses. Microsoft Azure offers reliable digital security resources that provide world-class protection.
Identity Control and Access Management with Azure
Modern security is only as dependable as people with access to your servers’ information. Azure Active Directory (AD) is an identity and access management tool that allows businesses to ensure that only authorized users get to access sensitive data. Use it to implement multi-factor authentication and single sign-on to make access management straightforward and airtight.
It also allows you to make access device or location-specific, limiting everyone else from getting their hands on your data.
Strong Storage Security
With Azure, you get several tools to encrypt data to keep it safe, whether in transit or secured in your database. A shared access signature allows users to delegate access and resources in storage. This makes it easy to allow access for a limited time to authorized individuals online.
Azure also offers Storage Analytics that lets you see access logs and provides in-depth data for your storage account. Use it to trace access requests, see usage trends and diagnose possible issues.
You also get to take advantage of a global incident response team that uses state-of-the-art resources to offer unified security management and advanced threat management solutions to all Azure users.
At Mobiz Inc., our goal is to help you do business more securely, and when you’re ready to take advantage of all the benefits the cloud offers, we’re here to help with expert services and advice tailored to your specific needs.
Aging and Inflexible Infrastructure
Technology is advancing by the minute, leaving you to deal with constant technical debt, legacy modernization and ongoing digital transformation projects. While this challenge may not hit you until later in the game, the time to prepare is now.
Setting up a new IT infrastructure or updating an old one comes with steep costs that are often too much for small businesses. But the alternative is lagging performance, risks of failure, and increasingly obsolete security measures.
Factor in the running costs, warranty issues, and possible downtime, and you’ve got an impending disaster on your hands.
You need innovative technology that grows with your business. While upgrades and replacements of physical components are inevitable, you can invest in evergreen tech that scales with the demands of your systems.
Azure is affordable and scalable, making it the right option for businesses. This means that you only pay for the services you use and to the extent you use them.
Moreover, it’s compatible and seamlessly integrates with the latest apps. This way, you don’t have to invest in periodic software upgrades to keep using the software that runs your business.
Additionally, as a cloud-based server or Infrastructure-as-a-Service (IaaS) provider, Azure offers cutting-edge security and tech solutions that get automatic updates and ongoing maintenance without needing much input. This way, you can rest assured that when you use Azure, it’s always the latest version with a 100% uptake.
Conclusion
With its architecture, software development, and platform as a service offering, Microsoft Azure Cloud has a lot to offer businesses of all sizes. You may be familiar with the challenges listed above from your own business experiences, or you might be curious to know how you will deal with them as you begin your journey with Azure.
Harness the full potential of Microsoft Azure with Mobiz Inc. With the help of our experts, you will be able to conduct effective cloud assessments, build a fully automated cloud foundation leveraging the Azure Landing Zone , perform successful migrations as well as implement a sound Cloud Ops and FinOps strategy to ensure your business maintains Operational Excellence and controls costs.
Get in touch with us for more details or speak with an expert.

Things to Consider When Expanding Your Network
This blog will discuss how you can prepare for IT growth as your business expands.
Your IT Network: A Careful Balance
All businesses seek growth, but in our experience it’s surprising how many are unprepared to handle increased burdens on their technology and the networks that support it. Network capacity and capabilities should be able to handle the needs of the present while keeping costs under control but flexible enough to be able to expand to take advantage of opportunities in the future.
When a business has a forward-thinking IT strategy, it’s better equipped to handle steady growth and sudden changes in the market. This is why small and medium businesses call on IT consulting experts like MOBIZ to move their networks where they need to be at such a crucial time. So much focus, resources, and planning are spent on other parts of the business that a trusted IT partner like MOBIZ can help alleviate additional capacity while also establishing a solid plan for the future.
Before you undertake any network expansion or revision project, here are some questions MOBIZ will help you answer:
Why Are You Expanding?
This may be the easiest to answer, but it’s extremely important because it will define the approach. Have you experienced sudden growth beyond projections? Are you expanding into new markets and new locations? Do you need to replace older equipment that is beyond its useful life? By answering these questions, we can help you turn a weakness into a strength
How Well Will Your Current Wireless Network Handle Increased Load?
Adding users and additional computers also adds pressure to your computer network. At the beginning of any engagement, MOBIZ puts your network through a number of rigorous tests that are proven to give an accurate measurement of the exact capabilities of your network, where it’s weak, and what needs to be done to further develop and improve it.
Who Will Need Access to the New Network?
Access permissions are important for businesses that handle sensitive information. Compliance is essential, but even if essential information isn’t regulated, any network audit takes control and access into account. Certain folders or passwords may need to be restricted and file ownership processes may need to be reviewed if employees move to different departments or leave the company altogether. Network security needs to be assessed and improved accordingly.
What Programs and Applications Will Be Critical for Future Growth?
Some applications you’ve been using may have been chosen solely on price. These kinds of temporary measures can restrict growth, especially when inadequate applications have been accepted as the norm. On the other hand, there is no reason to overpay for programs you don’t need. This is where a technology expert can help you assess what you use, how you use it, and where it will be in the next few years.
Do You Have a BYOD Policy?
Companies that allow employees to use their own phones, tablets, and laptops for work find it can make expanding capacity easier and cheaper. But this can also create serious document security issues if an employee loses their device or if they leave the company. While informal policies may work in the beginning, a formal bring your own device (BYOD) policy that is continually reviewed and updated helps answer crucial questions about how these devices and the sensitive information that is on them should be handled.
How MOBIZ Network Consulting Can Evolve to Managed Services
The final question is who will manage your new network, and this is where MOBIZ can provide the best value. As consultants, we’ve solved network issues for dozens of businesses at the enterprise level, expanding their global reach and developing a tool that will help them build measured, sustained growth. With added capacity comes added responsibilities, and we’re here to help manage and monitor your networks long past the initial project.
Benefit From Our Experience
There are plenty of things to worry about when guiding your business—your technology shouldn’t be one of them. Call us today for more information about MOBIZ and to schedule a network assessment. Our thorough IT environment assessment is a strategic, top-down picture of how your business works and how technology is used to complete your most important business processes. Our technicians can get to the root of any issue and provide solutions that last, not just temporary fixes.

Importance of Cyber Security and Risk Management
Did you know in 2021, Cybercrime cost the world more than $6 .9trillion? That’s more than the GDP of Japan and Germany combined! And it’s not just businesses that are at risk. Individual users are just as vulnerable, if not more so. A recent study showed from the Internet Crime Report of 2021, that personal data breaches cost victims $517 million.
The cost of a data breach is not just an expense for companies, but also for their reputation and potential loss of customers trust. The following are five countries or regions with the highest average costs:
According to the IBM Cost of Data Breach Report 2022, the United States has the highest average cost of a data breach at $9.44 million. This is followed by the Middle East at $7.46 million and Canada at $5.64 million. The United Kingdom has the fourth-highest average cost at $5.05 million, and Germany has the fifth-highest average cost at $4.85 million. The importance of cybersecurity and risk management cannot be understated. By taking a closer look at these issues, we can better understand why they are so important!
What is Cybersecurity & Why is it Important?
Cybersecurity is the practice of protecting your computer networks and user data from unauthorized access or theft. It’s important because it protects your valuable data and systems from being compromised. If your networks are hacked, you could lose vital information, be subject to financial theft, or even have your systems taken down.
Businesses and organizations have become increasingly reliant on electronic information and systems. As a result, the need for effective cybersecurity solutions has grown. Data breaches can cause significant financial damage to businesses and organizations. In addition, data breaches can also lead to the theft of identities, loss of customer trust, and damage to a company’s reputation.
Don’t be Fooled by These Cybersecurity Myths
Cybersecurity is a term that is often misunderstood. There are many myths and misconceptions about it, which can lead to dangerous security vulnerabilities. To help address some of these misconceptions, we have outlined four of the most common ones below.
Myth #1: Cybersecurity is only for large companies
One of the most common misconceptions about cybersecurity is that it is only for large companies with complex IT systems. The reality is that every organization, regardless of size or sector, is at risk of a cyberattack. Small businesses are often targeted by hackers because they are seen as easier targets.
Myth #2: Cybersecurity is too expensive
Another myth about cybersecurity is that it is too expensive to implement and maintain. While there may be some initial costs involved in setting up a robust security system, the long-term benefits far outweigh the investment. And, as technology advances, the cost of cybersecurity solutions continues to decrease.
Myth #3: I’m not a target so I don’t need to worry about cybersecurity
This myth is particularly dangerous as it can lead organizations to become complacent about their cybersecurity posture. The truth is that anyone can be a target for a cyberattack, regardless of their size or industry. Hackers are increasingly targeting smaller businesses and organizations because they are seen as easier prey.
Myth #4: Cybersecurity Solutions are Complicated to Use
Many people believe that cybersecurity solutions are complicated to use, which can deter organizations from implementing them. However, this is not always the case. There are many user-friendly solutions available that are easy to set up and use.
Don’t Be a Victim: Protect Yourself from The Top Common Cyber Threats
- Malware: is a type of software that is designed to damage or disable computers. According to the Internet Cyber Crime Report of 2021, Malware, Careware and viruses resulted in a loss of $5.596 million to victims.
- Ransomware: is a type of malware that locks you out of your computer until you pay a ransom. According to the Internet Cyber Crime Report of 2021, Ransomware costs $49.2 million in damages.
- Phishing: this is a type of scam where attackers send fraudulent emails purporting to be from reputable companies to steal your personal information. As the Internet Crime Report of 2021 shows, Phishing, Vishing, Smishing, and Pharming scams pulled in a total of $44.2 million last year.
- Social Engineering: this is a type of attack where cybercriminals use deception to gain access to your information or systems.
- Insider Threats: this is a type of attack where an insider, such as a current or former employee, contractor, or vendor, uses their access to your systems for malicious purposes.
- Distributed denial-of-service: (DDoS) attacks are where attackers attempt to take down a website or server by overwhelming it with traffic. These are just some of the risks that you face when you’re online. Denial of Service/TDos to users costs $217 thousand in 2021.
- Advanced Persistent Threats: (APTs) is a type of cyberattack where the group of intruders gains unauthorized access to a computer network and then remains there undetected for a long period.
- Man-in-the-middle: this is a type of attack where the cybercriminals insert themselves into a conversation between two parties to eavesdrop or intercept communications.
- Zero Day Attack: This cyber attack takes place on the same day that a new software vulnerability is discovered. hackers exploit the vulnerability before software developers can find a fix, which makes these attacks particularly difficult to defend against.
What is Risk Management & Why its Important?
Risk management is the process of identifying, assessing, and mitigating risks to an organization. It’s important because it helps organizations protect themselves from potential threats and vulnerabilities. By identifying and addressing risks, organizations can reduce the likelihood of being impacted by a negative event. In addition, risk management can also help organizations to improve their overall resilience and response to disruptions.
There are several key benefits of implementing a Risk Management Strategy. First, it can help to reduce the likelihood of accidents or other negative events occurring. Second, it can help to minimize the impact of these events if they do occur. Finally, it can also help to improve the overall efficiency of an organization’s operations.
How to Implement a Successful Risk Management Strategy?
Every organization faces risks, and the key to mitigating them is having a successful risk management strategy in place. Implementing a risk management strategy can be a daunting task, but it’s important to remember that every organization is different and will require a unique approach. Here are some tips on how to implement a successful Risk Management Strategy:
- Tailor your strategy to your organization’s specific needs.
- Review and update your strategy regularly.
- Make sure your team is properly trained in risk management procedures.
- Use risk management tools and techniques to identify and assess risks.
- Take action to mitigate risks whenever possible.
Risk Management Process
1. Identify Risks
This step involves identifying potential risks that could affect the organization. Risks can come from a variety of sources, such as internal operations, external threats, or market conditions This can be done through a variety of methods, such as brainstorming sessions, interviews, surveys, and data analysis.
2. Risk Analysis and Assessment
Once risks have been identified, they need to be assessed to determine their potential impact on the organization. This step involves considering factors such as the likelihood of an event occurring and the potential severity of its impact. This helps determine which risks are most urgent and need to be addressed immediately.
3. Mitigating Risks and Monitoring
After risks have been identified and assessed, mitigation strategies can be implemented to reduce their impact or likelihood of occurrence. Some common ways of mitigating risks are by either reducing or getting rid of exposure to potential cyber-attacks, putting in place controls or security measures, contingency plans, and increasing communication and training. Additionally, it’s important to monitor the risks that have been identified to ensure they’re being managed effectively. This includes keeping tabs on any changes in severity or likelihood of each risk so you can take appropriate action if necessary.
What are the most common responses to risk?
There are five common responses to risk: Avoidance, Reduction, Transfer, Sharing, and Acceptance.
- Risk reduction is when an organization takes steps to reduce the amount of risk that is associated with a particular activity or process. This can be done by changing how a process is done or by discontinuing certain activities altogether.
- Risk Sharing is the exchange of information about risks between two or more entities to identify and manage those risks together. Transferring risk is the process of moving the responsibility for dealing with a risk from one party to another. This can be done through insurance policies or contracts.
- Transferring Risk is when an organization transfers the risk to another party. This can be done through a variety of methods, such as insurance policies, contracts, or joint ventures.
- Accepting and Retaining Risk is when an organization decides to accept the risks that are associated with a particular activity or process. This can be done by either ignoring the risks or by taking steps to mitigate them.
Businesses Can No Longer Afford To Ignore Cyber Security
Cybercrime is a worldwide problem that’s costing companies $10.5 trillion annually by 2025, up from 3 trillion dollars in 2015! This means cyber security will soon become one of the most important aspects for any business to address – it may even represent their greatest transfer or economic wealth ever if growth rates continue at this rate (15% per year).
This rapid growth rate means cyber criminals are transferring economic wealth into their bank accounts at an unprecedented level and represent one of history’s greatest transfers from people to government officials or hackers themselves to maintain power over these industries’ assets. It’s therefore more important than ever for businesses to take steps to protect themselves against cybercrime by implementing strong cyber security and risk management policies.
Get Serious about Cybersecurity with Mobiz
It is time to stop being naive when it comes to cybersecurity. Mobiz is your go-to cybersecurity and risk, management provider. We make sure you do business better, by leveraging all the benefits the digital world has to offer. We partner with Palo Alto networks to provide the best cybersecurity solutions on the market today! We also build on that with custom Artificial Intelligence (AI) tools and solutions to automate certain segments of cybersecurity monitoring and safety. AI tools help Mobiz manage the influx of cyber threats more productively by supplementing the human experience.
Whether you’re just starting out with a cybersecurity and risk management approach, or you are looking for more sophisticated solutions, we have expert services and advice designed specifically for your needs. You can’t afford to wait any longer. We must not be reactive, but proactive when it comes to cyber warfare.
Contact us today and let’s get started on securing your Cyber Future!

Short-Term Wind Energy Forecasting Using Deep Learning-Based Predictive Analytics
Noman Shabbir, Lauri Kütt, Muhammad Jawad, Oleksandr Husev, Ateeq Ur Rehman, Akber Abid Gardezi, Muhammad Shafiq and Jin-Ghoo Choi.
Abstract
Wind energy is featured by instability due to a number of factors, such as weather, season, time of the day, climatic area and so on. Furthermore, instability in the generation of wind energy brings new challenges to electric power grids, such as reliability, flexibility, and power quality. This transition requires a plethora of advanced techniques for accurate forecasting of wind energy. In this context, wind energy forecasting is closely tied to machine learning (ML) and deep learning (DL) as emerging technologies to create an intelligent energy management paradigm. This article attempts to address the short-term wind energy forecasting problem in Estonia using a historical wind energy generation data set. Moreover, we taxonomically delve into the state-of-the-art ML and DL algorithms for wind energy forecasting and implement different trending ML and DL algorithms for the day-ahead forecast. For the selection of model parameters, a detailed exploratory data analysis is conducted. All models are trained on a real-time Estonian wind energy generation dataset for the first time with a frequency of 1 h. The main objective of the study is to foster an efficient forecasting technique for Estonia. The comparative analysis of the results indicates that Support Vector Machine (SVM), Non-linear Autoregressive Neural Networks (NAR), and Recurrent Neural Network-Long-Term Short-Term Memory (RNN-LSTM) are respectively 10%, 25%, and 32% more efficient compared to TSO’s forecasting algorithm. Therefore, RNN-LSTM is the best-suited and computationally effective DL method for wind energy forecasting in Estonia and will serve as a futuristic solution.
Keywords: Wind energy production; energy forecast; machine learning
Introduction
The worldwide energy demand is increasing with every passing year so is the environmental pollution due to the brown energy generation from fossil fuels. Therefore, the uses of Renewable Energy Resources (RES) like solar and wind have gained popularity due to lower carbon emissions. However, wind energy generation is variable and unstable due to variations in wind speed [1,2]. The variable nature of wind depends on geographical area, weather, time of day, and season. Therefore, predicting wind power generation with 100% accuracy is a very difficult task [3]. However, this prediction is highly important for the management of demand and supply in power grids and also has an economic impact [4,5]. This prediction was usually made using statistical methods [6], such as moving average and autoregressive, but the accuracy of the models was relatively low. Machine learning (ML) based forecasting algorithms are a widely used tool due to their property to capture nonlinearities in the data with high accuracy, but machine learning algorithms usually require a large dataset of formation to develop an efficient forecasting model. These models are trained, validated, and tested; sometimes they still require retraining to obtain more precise results [7]. The forecasting models are usually divided into three categories, such as short-term forecasting (few minutes to 24 h), medium-term forecasting (days-ahead to week-ahead), and long-term forecasting (month-ahead to year-ahead) [8]. In this study, the real-time dataset of Estonian wind energy generation is used [9,10] for the development of these forecasting models.
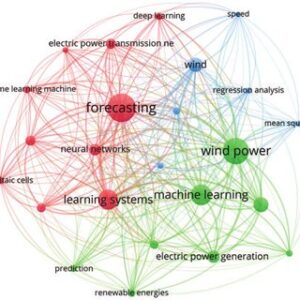
In the past, several research works have been developed using deep methods for wind speed forecasting and wind power generation forecasting. A bibliometric visualization of the keywords used in previous studies conducted in the past 5 years related to wind energy furcating has been made in VOS viewer software and depicted in Fig. 1. The figure shows the keywords used in 238 articles in the last five years related to wind energy forecasting. The forecasting of the wind speed in a university campus in Switzerland is being made using the ridge regression technique [11]. In a similar study [12], different ML algorithms like Support Vector Machine (SVM), K-Nearest Neighbor (KNN) regression, and random forest are compared for the forecasting of wind speed and corresponding energy generation for the day-ahead prediction horizon. A hybrid genetic algorithm and SVM-based algorithm are developed and tested for under-learning and overlearning scenarios of forecasting to determine the optimal solution [13]. A review of a supervised ML algorithm is made in [14]. In another work, ANN-based algorithms are developed and simulated to predict wind energy generation for grid stability [15]. A novel Cartesian genetic Artificial Neural Network (ANN) based algorithm is also proposed for wind energy forecasting in [16], which includes Hybrid regression based on SVM, Convolutional neural network (CNN), and singular spectrum analysis (SSA). The experimental results showed that SVM gave better predictions [17]. In [18], Extreme Machine Learning (ELM) algorithms have been used to forecast the wind speed for energy generation. A comparison of ELM, Recurrent Neural Networks (RNN), CNN, and fuzzy models is also given in [19–22] and future research directions are also explored. Tab. 1 provides a summary and comparison of the few known research articles related to wind energy forecasting using ML algorithms including Self-adaptive Evolutionary Extreme Learning Machine (SAEELM), Multilayer Perceptron (MLP), Random Forest (RF), Linear Regression (LR), Extremely Randomized Trees (ET), Radial Basis Function Neural Network (RBFNN), Gradient Boosting Algorithm (GBM), Tree Regression (TR), Long Short-Term Memory Networks (LSTM), Two-stream Deep Convolutional Neural Networks (TDCNN), Mean absolute percentage error (MAPE).


From all the above studies, it is clear that ML and DL algorithms are very useful in wind energy forecasting. However, it is still a very difficult thing to make an accurate prediction and a universal model is not possible. Therefore, every scenario requires a local dataset of wind speed, weather information, and location. Each model needs to be customized, built, and then trained. This accurate forecasting will help in the better management of demand and supply, smooth operation, flexibility and reliability and as well as economic implication.
In this research, a comparison has been made between different machine learning and DL forecasting algorithms for a day-ahead wind energy generation in Estonia. The historical data set on one-year Estonian wind energy generation was taken from the Estonian Transmission System operator (TSO) called ELERING [9]. This historical data contains all of the above-stated factors that affect wind energy generation. On the basis of this data, different forecasting algorithms are modeled, trained, and compared.
The key contributions of this paper are summarized as follows:
• To address the problem of wind energy forecasting in Estonia, state-of-the-art ML and DL algorithms are implemented and rigorously compared based on performance indices, such as root mean square error, computational complexity, and training time.
• A detailed exploratory data analysis is conducted for the selection of optimal models’ parameters, which proves to be an essential part of all implemented ML and DL algorithms.
• A total of six ML NAR and two DL algorithms are implemented, such as linear regression, tree regression, SVM, ARIMA, AR, NAR, ANFIS, and RNN-LSTM. All implemented algorithms are thoroughly compared with currently implemented TSO forecasted wind energy and our proposed RNN-LSTM forecasting algorithm proves to be a more accurate and effective solution based on performance indices.

Machine Learning Algorithms for Forecasting
The most common ML tool for forecasting is regression-based algorithms [19]. Regression-based learning is categorized into supervised learning algorithms that use past data sets of the parameters in the training of the model and then predict the future values of the parameters based on the regressed time lag values of the parameters, where the number of lag selections is based on observation. Moreover, the most used DL algorithms in time series prediction are RNN and CNN. In CNN, the output only depends on the current input while in RNN, the output depends both on the current and previous values that provide an edge to RNN in time series prediction. In this section, machine learning and deep learning algorithms used in this study are elaborated.
Linear Regression
This simplest and most commonly used algorithm computes a linear relationship between the output and input variables. The input variables can be more than one. The general equation for linear regression is along with its details can be found in [7].
Tree Regression
This algorithm deploys a separate regression model for the different dependent variables, as these variables could belong to the same class. Then further trees are made at different time intervals for the independent variables. Finally, the sum of errors is compared and evaluated in each iteration, and this process continues until the lowest RMSE value is achieved. The general equation and the details of the algorithm are described in [7].
Support Vector Machine Regression (SVM)
SVM is another commonly used ML algorithm due to its accuracy. In SVM, an error margin called ‘epsilon’ is defined and the objective is to reduce epsilon in each iteration. An error tolerance threshold is used in each iteration as SVM is an approximate method. Moreover, in SVM, two sets of variables are defined along with their constraints by converting the primal objective function into a Lagrange function. Further details of this algorithm are given in [7,39,40]:
Recurrent Neural Networks
The RNN is usually categorized as a deep-learning algorithm. The RNN algorithm used in this paper is the Long Short-Term Memory (LSTM) [41]. In LSTM, the paths for long-distance gradient flow are built by the internal self-loops (recurrences). In this algorithm, to improve the abstract for long time series based different memory units are created. In conventional RNN, the gradient vanishing problem is a restriction on the RNN architecture to learn the dependencies of the current value on long-term data points. Therefore, in LSTM, the cell data are kept updated or deleted after every iteration to resolve the vanishing gradient issue. The LSTM network in this study consists of 200 hidden units that were selected based on the hit-and-trial method. After 200 hidden units, no improvement in the error is observed.
Autoregressive Neural Network (AR-NN)
This algorithm uses feedforward neural network architecture to forecast future values. This algorithm consists of three layers, and the forecasting is done iteratively. For a step ahead forecast, only the previous data is used. However, for the multistep ahead, previous data and forecasted results are also used, and this process is repeated until the forecast for the required prediction horizon is achieved. The mathematical relationship between input and output is as follows [42]:
yt=w0+h∑j=1wj.g(w0,j+n∑i=1wi,j.yt−1)+εtyt=w0+∑j=1hwj.g(w0,j+∑i=1nwi,j.yt−1)+εt(1)
where wi.j,wj(iwi.j,wj(i,jj = 0, 1, 2,…, n, j = 1, 2, …, hh) are parameters for the model; n represents the input nodes, h is the number of hidden nodes. In addition, a sigmoid function is used for the hidden layer transfer function as defined in Eq. (2) [42].
sig(x)=11+exp(−x)sig(x)=11+exp(−x)(2)
Non-Linear Autoregressive Neural Network
The Nonlinear Autoregressive Neural Network (NAR-NN) predicts the future values of the time series by exploring the nonlinear regression between the given time series data. The predicted output values are the feedback/regressed back as an input for the prediction of new future values. The NA-NN network is designed and trained as an open-loop system. After training, it is converted into a closed-looped system to capture the nonlinear features of the generated output [43]. Network training is done by the back-propagation algorithm mainly by the step decent or Levenberg-Marquardt back-propagation procedure (LMBP) [44].
Autoregressive Integrated Moving Average (ARIMA)
This model is usually applied to such datasets that exhibit non-stationary patterns like wind energy datasets. There are mainly three parts of the ARIMA algorithm. The first part is AR where the output depends only on the input and its previous values. Eq. (3) defines an AR model for the p-order [45]:
yt=c+∅1yt−1+∅2yt−2+…∅pyt−p+∈tyt=c+∅1yt−1+∅2yt−2+…∅pyt−p+∈t(3)
where tt is the number of lags, Ø is the coefficient of the lag, c is the intercept term and ∈t∈t is white noise. MA is the second part that describes the regression error as a linear combination of errors at different past time intervals. Eq. (4) [45] describes the MA as follows,
yt=∈t+∅1∈t−1+∅2∈t−2+…∅p∈t−pyt=∈t+∅1∈t−1+∅2∈t−2+…∅p∈t−p(4)
The third part ‘I’ describes that the data have been updated by the amount of error calculated at each step to improve the efficiency of the algorithm. The final equation of ARIMA is as follows [45]:
yt=c+∅1yt−1+∅2yt−2+…∅pyt−p+∅1∈t−1+∅2∈t−2+,…,∅p∈t−pyt=c+∅1yt−1+∅2yt−2+…∅pyt−p+∅1∈t−1+∅2∈t−2+,…,∅p∈t−p(5)
Adaptive Neuro-Fuzzy Inference System (ANFIS)
This algorithm is a hybrid of ANN and Fuzzy logic. In the first step, Takagi and Sugeno Kang’s fuzzy inference modeling method is used to develop the fuzzy system interference [46]. The overall model in this algorithm consists of three layers. The first and last layers are adaptable and can be modified accordingly to the design requirements while this middle layer is responsible for the ANN and its training. In the fuzzy logic interference system, the fuzzy logic structures and rules are defined. Moreover, it also includes fuzzification and defuzzification as well.
This algorithm works on Error Back-propagation (EPB) model. The model employs Least Square Estimator (LSE) in the last layer which optimizes the parameters of the fuzzy membership function. The EBP reduces the error in each iteration and then defines new ratios for the parameters to obtain optimized results. However, the learning algorithm is implemented in the first layer. The parameters defined in this method are usually linear [46,47].
Exploratory Data Analysis
Estonia is a Baltic country located in the northeastern part of Europe. Most of its energy is generated from fossil fuels, whereas the RESs are also contributing significantly. The average share of fossil fuels is around 70% for the year 2019, while renewables are around 30% [9]. Although 30% is still higher as per the EU plan for renewable integration in the grid by 2020 [9]. As per the 35% share in RE, wind energy is the second most used resource in Estonia after biomass in 2019 [9], which makes it very important. The energy demand in Estonia is usually high in winter and the peak value is around 1500 MWh, while the average energy consumption is around 1000 MWh. Meanwhile, the average energy generation is around 600 MWh and the peak value is around 2000 MWh [9]. The demand and supply gap can vary between 200 to 600 MWh and is almost the same throughout the year. This gap is overcome by importing electricity from Finland, Latvia, and Russia if needed [9].
In Estonia, a total of 139 wind turbines are currently installed, mainly along the coast of the Baltic Sea [10]. Fig. 3 shows the geographical location of the installed sites. The installed capacity of these wind turbines is around 301 MW. In addition, there are 11 offshore and two offshore projects under the development phase. The plan is to have 1800 MW of wind power generation by the year 2030 [10]. The current share of wind energy is only around 10% of the total energy generated in Estonia. However, according to EU regulations, environmental factors, and self-dependency, this share will increase rapidly in the future. Therefore, due to the stochastic nature of wind speed, accurate prediction of wind power generation will be essential to manage demand and supply. A good and advanced prediction technique is required for an accurate wind power generation prediction in Estonia. This study provides a detailed and wide exploratory and comparative analysis for wind power generation forecasting by employing multiple linear and nonlinear ML and Deep Learning (DL) techniques.

The data set used in this article is the Estonian general data on wind energy generation from 1 January 2011 to 31 May 2019. The frequency of the data set is one hour. This data set for wind energy generation is highly variable due to the weather conditions in Estonia. The maximum value of wind energy production in the aforementioned period is nearly 273 MWh, the mean value is 76.008 MWh, the median is 57.233 MWh, and the standard deviation is 61.861 MWh. To demonstrate the variable nature of the time series dataset for Estonian wind power generation, the moving average and the moving standard deviation are the best tools to elaborate on this dynamic nature of the dataset. Fig. 4 shows the wind energy production data along with the moving average and the moving standard deviation from Jan. 2018 to May 2019. It is clear from Fig. 4 that there are no clear peaks in wind energy or low seasonal values. Wind energy production is variable throughout the whole year. As indicated by the moving average, wind energy generation is high in winter (November to March), but even in that time, its value drops for a few weeks and then again increases.
The histogram and the probability density function (PDF) of the data are shown in Fig. 5a, which indicates that the wind energy production is below 50 MWh most of the time and its value rarely goes above 250 MWh. The histogram data is now normalized to compute the actual probability of different energy production values. The resultant probabilities are depicted in Fig. 5b. These probability values also indicate the same analogy. For example, the probability of getting 100 MWh energy is around 20% and 250 MWh is only around 3%. Therefore, the accuracy for the prediction of peak power generation or above-average power generation is a challenging task. Further analysis of this data set is performed using autocorrelation analysis. Fig. 5c shows the autocorrelation analysis of the data set.
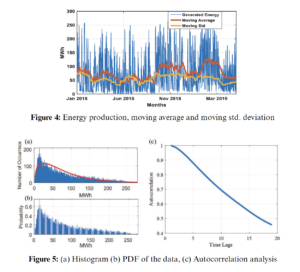
In time-series analysis, the autocorrelation measure is a very useful tool to observe the regression nature of the time-series data and provides a birds-eye view for the election of the number of lags if any regression-based forecasting model is employed. It is the correlation of the signal with its delay version to check the dependency on the previous values. In this graph, the lag of 20 h is shown, in which the lags up to the previous 16 h have a regression value above 0.5 percent and after which it drops significantly below 0.5. The confidence interval is identified by the calculated 2 values. The correlation decreases slowly over time, which shows long-term dependency. The description of this observation is described in [48]. However, the autocorrelation of wind energy generation does not decrease rapidly with weather changes related to different seasons. This exploratory data analysis helps us to estimate design, and parameter selection for all ML and deep-learning algorithms defined earlier.
Forecasting of Wind Energy
The Estonian wind energy dataset has been used in this research. The dataset is then divided into training, testing and validation and the divisions of data are 80%, 10% and 10%, respectively. All these simulations are carried out in Matlab2021a in a Windows 10 platform running on an Intel Core i7-9700 CPU with 64 GB RAM. Initially, the training data was converted into standard zero mean and unit variance form to avoid convergence in the data. The same procedure was carried out for the test data as well. The prediction features and response output parameter has also been defined for a multistep ahead furcating. The Estonian TSO is responsible for the forecasting of wind energy generation on an hourly basis. Their prediction algorithm forecasts wind energy generation 24 h in advance. It also generates the total energy production and the anticipated energy consumption. Fig. 6 shows the values of wind energy production and the values forecasted by the TSO algorithm for May 2019 [49].
 Most of the time, the actual energy generation is much higher than the forecast values. The gap can go up to 70 MWh, which is too much. The forecasting algorithms need to be more accurate than that. This variation can falsely tell the energy supplier to use alternative energy sources rather than wind. This may be fossil fuel or any other resource, which will cost more to the supplier and eventually the customer. This low accuracy allowed us to study, develop, and propose a comparatively suitable forecasting algorithm for the prediction of wind power generation in Estonia.
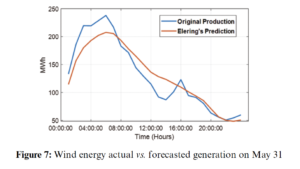
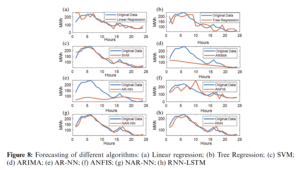
In this study, the emphasis is on the accurate prediction of wind energy generation in Estonia. Eight different algorithms based on machine learning and DL are simulated and tested using the 1-year wind energy generation data set for a day-ahead prediction horizon. The results of all employed algorithms are compared based on RMSE values. Fig. 7 shows the comparison of actual wind energy generation and the forecast wind energy generation of TSO for 31 May 2019. It is clear from the figure that there is a substantial gap between the original and predicted values. The RMSE value for TSO forecasting is 20.432. The forecasting of all algorithms is tested on the same day as shown in Fig. 8.
Results and Discussions
The wind power generation data understudy has a highly nonlinear nature; therefore, a vast variety of linear and nonlinear forecasting algorithms need to be tested to find an appropriate option. A thorough comparative analysis is conducted to compare the accuracies of all forecasting algorithms employed in this paper. Machine learning algorithms, such as linear regression, AR, ARIMA, and tree-based regression, are not performed adequately, while SVM is given good forecast accuracy.
On the contrary, deep-learning algorithms, such as NAR and RNN, have a high degree of accuracy compared to all other algorithms employed as the architectures for both algorithms have the capability to capture nonlinear features of the data. However, the ANFIS also gives relatively low accuracy. The ML algorithms are not showing accuracy as the data is highly non-linear and therefore the ML algorithms do not perform better curve fitting and result in lower accuracy as compared to DL methods.
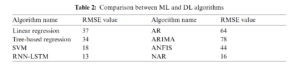
DL models, in contrast, due to the ANN fitted the curve better and therefore gave more accurate forecasting results. Thus, these results indicate that for this time series-based forecasting the efficiency of DL methods is higher as compared to ML methods. The comparative analysis of ML algorithms and DL algorithms based on the RMSE value is depicted in Tab. 2. In addition, to the best of the author’s knowledge, this study is the first comprehensive comparative analysis between the know ML and DL algorithms for wind power generation data in Estonia.
Furthermore, it is pertinent to mention that this energy forecasting topic has been under investigation for decades. The main issue is still the accuracy of forecasting. The main focus is to forecast wind energy on the basis of past data and not wind speed. Some researchers have tried to develop some hybrid models as well. However, it is extremely difficult to compare the results of these studies with our study as there are many parameters involved like the size of the dataset, location, time span, and then the algorithm used.
In this study, the best results are shown by the RNN-LSTM algorithm. The algorithm consists of 100 hidden units in the LSTM layer. This number of hidden units is obtained by the hit and trial method, the numbers are varied from 20 to 250. The models showed the best results for 100 units and after that, the results remained almost the same. It is using historical data only. Therefore, the number of features is one and the response is also one. The training of the algorithm is carried out by an ‘ADAM’ solver and the number of Epochs was also varied from 50–250 epochs. When the whole data set passes through the back or forward propagation through the neural network then it is called an Epoch. Learning rate is used to train the algorithm and when a certain number of Epochs are passed then it is dropped to a certain value. The initial learning rate was defined as 0.005. The gradient threshold is also one. The simulation parameters are described in Tab. 3.

In order to make multistep predictions, the prediction function makes a forecast of a single time step; and then updates the status of the network after each prediction. Now, the output of the first step will act as the input for the next step. The size of the data is also varied and tested between 1 month and 96 months to observe its impact on the forecasting algorithm. The simulation results show that after the data size is more than 24 months, the performance of this algorithm does not affect. Almost, the same RMSE value is obtained for 36, 60, and 96 months. The comparison is shown in Tab. 4. The RMSE values and the corresponding training time are also shown in Tab. 4.

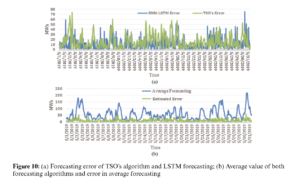
Fig. 9 shows the compression of actual wind energy production of TSO, the forecasted production and our algorithm for May 2019. It is clear from the graph that RNN-LSTM is providing better forecasts throughout the month. The RMSE value of the TSO furcating is 25.18 while the RNN forecasting is 15.20 for the whole month. Fig. 10a shows the error of both the TSO forecasting algorithm and the proposed RNN-LSTM algorithm. It is also clear from the graph that TSO’s forecasting error is higher. The TSO’s algorithm predicts a small variation in output energy well but fails when there are large fluctuations. On the other hand, RNN-LSTM is forecasting the large functional well but sometimes does not work that well with continuous low values of energy prediction. Therefore, a hybrid of both algorithms can be proposed here that will overcome both the low and high fluctuation. The results are shown in Fig. 10b. The error in forecasting is also depicted here. The error in forecasting is quite low now as is observed from the graph. The RMSE value for this hybrid forecasting is 8.69.

Conclusions
In the past decade, ML and DL have become promising tools for forecasting problems. The highly nonlinear behavior of weather parameters especially wind speed makes it a valid challenging problem to use ML and DL algorithms for wind energy forecasting for smart grids. Moreover, an accurate time-series forecasting algorithm can help provide flexibility in modern grids and have economical and technical implications in terms of demand and supply management and for the study of power flow analysis in power transmission networks. In this paper, six ML and two DL forecasting algorithms are implemented and compared for Estonian wind energy generation data.
Wind energy accounts for approximately 35% of total renewable energy generation in Estonia. This is the first attempt to provide an effective forecasting solution for the Estonian energy sector to maintain power quality on the existing electricity grid. We target the day-ahead prediction horizon, which is the normal practice for the TSO forecasting wind energy model. Real-time year-long wind energy generation data are used for the comparative analysis of the ML and DL algorithms employed. Moreover, the results of all employed models are also compared with the forecasting results of TSO’s algorithm. The comparison of all ML and DL algorithms is based on performance indices, such as RMSE, computational complexity, and training time. For example, the results for May 31, 2019, illustrated that TSO’s forecasting algorithm has an RMSE value of 20.48. However, SVM, NAR, and RNN-LSTM have lower RMSE values. The results conclude that SVM, NAR, and RNN-LSTM are respectively 10%, 25%, and 32% more efficient compared to TSO’s forecasting algorithm. Therefore, it is concluded that the RNN-LSTM based DL forecasting algorithm is the best-suited forecasting solution among all compared techniques for this case.

AI On Cruise Ships: The Fascinating Ways Royal Caribbean Uses Facial Recognition And Machine Vision
Editor’s note: This is a re-post of an article from Forbes.
In the travel industry, the primary use cases for artificial intelligence (AI) and machine learning technologies revolve around improving customer experiences.
Chatbots, in particular, have proven popular across this industry, with natural language processing (NLP) applied to the challenges of dealing with customer inquiries and providing personalized travel experiences.
Alongside this, recommendation engines power the most popular online travel portals such as Expedia and Trivago, combining customer data with information on millions of hotel vacancies and airline flights worldwide.
However, when it comes to operators, compared to other industries such as finance or healthcare, the travel industry as a whole is at an early stage when it comes to organization-wide deployment of smart, self-learning machine technology.
One industry leader that is bucking this trend, though, is cruise operator Royal Caribbean Cruises. In recent years, the world’s second-largest cruise operator has put AI to use to solve several problems.
As far as customer experience is concerned, the overriding goal has been to remove the “friction” often experienced. Until recently, this was seen as an inevitable consequence of having to check in a large number of passengers at a single departure time, rather than deal with a continuous flow of guests arriving and departing, as at a hotel or resort.
The company’s SVP of digital, Jay Schneider, tells me “Our goal was to allow our customers to get ‘from car to bar’ in less than 10 minutes.
“Traditionally it would take 60 to 90 minutes to go through the process of boarding a ship, and as a result, people didn’t feel like they were on vacation until day two – we wanted to give them their first day back.”
A vital tool in achieving this aim was the deployment of facial recognition technology. It uses computer-vision equipped cameras that can recognize travelers as they board, cutting down the need for verifying identity documents and travel passes manually.
This could have been done by providing customers with wearables such as a wrist band; however, the decision was taken to eliminate the need for external devices by using biometric identifiers – faces.
“We wanted to get people on their vacations as quickly as possible, and we didn’t want to have to ship every passenger a wearable – we want you to use the wearable you already have, which is your face.”
Computer vision-equipped cameras are built into the terminals that customers interact with as they board, and sophisticated algorithms match the visual data they capture with photographic identification which is submitted before their departure date.
AI doesn’t stop improving customer experience once guests are on board. Several other initiatives are designed to make passengers more comfortable or help them make the most of their time. These range from personalized recommendations for how they should spend their time on board, to monitoring and managing footfall as people move around the boat and queue to make use of services.
These monitoring systems are also powered by computer vision, but rather than recognizing individual faces, they monitor the build-up of bodies as passengers move about, allowing congestion to be detected and dealt with where necessary.
The technology for this application was built in partnership with Microsoft, and involved retro-fitting existing CCTV cameras with smart technology. This avoided the need for ships to be taken out of action while the entire camera network was upgraded with computer vision cameras.
“We have massive ships – we didn’t want to take them out of service, gut them and put sensors in, so we worked with Microsoft to understand how we could leverage our existing and somewhat antiquated CCTV cameras.
“Microsoft was a great partner … we threw our data scientists at the problem, and we’ve been able to take old cameras, as well as fisheye cameras, and detect humans through the use of AI.
“There’s a ton of use cases – it gives us information on things like table turnover times in restaurants, and we’re going to start using it from this summer to alert crew members when lines are backing up.”
This will mean crew can be redeployed in real time to wherever their services are in demand.
Another initiative is aimed at cutting down on food that goes to waste on board cruise liners. With 65,000 plates of food served daily aboard the vessel Symphony of the Seas, AI helps make decisions about how much food should be stocked to ensure guests don’t go hungry while keeping wastage to a minimum.
“We like to think we’re probably the most sustainability-friendly cruise line – and one of the things we’ve focused on when deploying AI is working towards our goals of improving sustainability. Outside of the cost savings, and improved freshness of the food we serve, it has sustainability benefits … we’ve seen a reduction in food waste as a result of this pilot,” says Schneider.
The most recent application – which began trials just weeks ago – is Royal Caribbean’s chatbot, styled as a virtual concierge, which allows passengers to ask questions about their voyage, destinations, or how they should spend their time on board.
“The whole idea, again, is to pull people out of lines – we don’t want passengers waiting in line at guest services to get questions answered, we want them to be able to get the information they need right away,” Schneider tells me.
The chatbot employs NLP and machine learning to understand what the most commonly asked questions are, and become more efficient at providing personalized answers. It uses a “human-in-the-loop” model, meaning that if it can’t work out what a customer wants, a human customer service agent is paged into the conversation. The NLP algorithms are then capable of learning how they could have tackled the question, by monitoring the human agent’s response.
With this, as with its other AI initiatives, Royal Caribbean follows a model of carefully monitored, small-scale trial deployments, before individual initiatives are put into organization-wide use.
Schneider tells me “We believe we get the best results with this method … test, adjust, scale … rather than ‘ready, fire, aim’ – which the rest of our industry seems to do! So, once we’ve carefully tested it and we’re sure it’s ready to go, we will scale it.”
When it comes to gathering data, cruise operators like Royal Caribbean are in a unique position, as they effectively function as hotels, food and beverage providers, supply chain and logistics operations, shipping operators and entertainment and gaming companies, all rolled into one.
This means customer journeys can be tracked and data gathered across all of these functions, enabling a holistic approach to data-driven customer service.
“As you can imagine,” Schneider says, “there are any number of opportunities … we’ve focused on yield management in cabin occupancy … the list goes on.
“We’re focused on testing, adjusting and scaling examples of where we can use AI to change the customer and the crew experience. Not everything has been successful, but the vast majority have shown early signs of success, and we’ve been extremely thrilled with the results so far.”

Personalized Information Retrieval from Friendship Strength of Social Media Comments
Fiaz Majeed, Noman Yousaf, Muhammad Shafiq, Mohammed Ahmed Basheikh, Wazir Zada Khan, Akber Abid Gardezi, Waqar Aslam and Jin-Ghoo Choi
Abstract: Social networks have become an important venue to express the feelings of their users on a large scale. People are intuitive to use social networks to express their feelings, discuss ideas, and invite folks to take suggestions. Every social media user has a circle of friends. The suggestions of these friends are considered important contributions. Users pay more attention to suggestions provided by their friends or close friends. However, as the content on the Internet increases day by day, user satisfaction decreases at the same rate due to unsatisfactory search results. In this regard, different recommender systems have been developed that recommend friends to add topics and many other things according to the seeker’s interests. The existing system provides a solution for personalized retrieval, but its accuracy is still a problem. In this work, we have proposed a personalized query recommendation system that utilizes Friendship Strength (FS) to recommend queries. For FS calculation, we have used the Facebook dataset comprising of more than 22k records taken from four different accounts. We have developed a ranking algorithm that provides ranking based on FS. Compared with existing systems, the proposed system can provide encouraging results. Key research groups and organizations can use this system for personalized information retrieval.
Introduction
Most ordinary people use social media to express their views, opinions and share their feelings. Online social networks have become an important source of public opinion. Aweb-based social network is a place where a large amount of data is distributed by ordinary people of different ages, different groups, different countries and different areas of life. It enables them to connect with each other, discuss and share ideas, information, pictures, sounds and videos. They also express their emotions, feel and make friends. People firmly believe in news, assessments and information about all aspects of life that are shared through social networks. It helps them keep in touch with their peers or other people related to their studies, business, entertainment and other activities.
The level of friendship defines the level of trust in social media communications. This is how we evaluate friendship strength (FS) based on the Facebook data set. Facebook interactions (such as many photo tags and posts on the wall) are used to calculate FS [1]. These two attributes are still very effective for forecasting. Traditional technology uses user profile data to calculate the strength of the relationship between various users [2]. The user’s profile data provides detailed information about his hobbies, religious views, companions, work experience, etc. On the other hand, interactive activities such as commenting, sending messages, and tagging refer to the intimacy of friends.
In recent years, according to several studies, various types of advice-based work have been carried out based on the level of friendship. Various researchers are studying friend suggestions similar to Facebook mechanism [3]. Facebook recommends friends mainly based on mutual friends. User profiles are established based on historical records of performed activities, such as items explored and queries [3]. Then, provide different documents or queries as suggestions according to the configuration file.
Traditional information retrieval (IR) systems mainly return results based on keyword matching. If different users submit the same query, the system returns the same results to all users. The difference between the Personalized Information Retrieval (PIR) system and the traditional system is that it not only provides results related to the query, but also provides results related to the user who submitted the query. In order to provide better results, the PIR system will keep the user’s previous search history and provide result retrieval accordingly.
In this article, we propose a technique to perform PIR from the Facebook comments of close friends. First, the comment data is based on the FS ranking, and the FS is calculated based on the number of likes, comments and tags. FS is also used to rank the retrieved annotations based on user queries. These ranking comments are displayed as a pop-up menu for suggestions/expansion of the target query. When the user types in any keyword, suggestions will appear on the basis of FS and keyword matching. To evaluate the proposed method, we collected comments from friends’ Facebook accounts. After that, the data is preprocessed and FS is calculated. To conduct experiments, a search engine has been developed in which users can enter queries. The experiment was conducted on the query set and the results were compared with the parallel system. The main contributions of this paper can be summarized as follows:
- We made a query suggestion based on the FS metric used for ranking.
- We have developed a query suggestion algorithm based on social media comments
- We have also developed a recommendation system, which has been developed to provide FS-based recommendations.
The rest of this article is organized as follows. In Section 2, a summary of relevant literature is provided. The system model is introduced in Section 3, and the experimental evaluation is carried out in Section 4. Finally, conclusions are drawn in Section 5.
Related Work
The literature review is divided into the following subsections.
Friendship Strength
Calculation Using social media data sets for financial statement calculations is still an effective method for different types of analysis. Previously, different attributes were used for FS calculations. A model has been established to calculate relationship strength based on user similarity and interactivity. The model was developed with the help of nodes and links. Nodes represent users, and links represent relationships between users [4]. Similarly, reference [1] suggests that transaction information can be used to measure relationship strength. This is a supervised learning method.
Alot of work has been done on personal similarity. These properties are good, but not the most effective for strength calculations. User profile information and communication tools (such as emails and messages) are used to calculate relationship strength [5]. In Xiang [4], latent variables have been used to calculate relationship strength. The user’s personal data and message history have been used for estimation in the latent variables. Some researchers have conducted research on “FS intensity” and the results have been ranked from closest friends to ordinary friends. Reference [6] proposed a model that uses social media data to show link strength. The link strength is divided into two types: strong relationship and weak relationship, which means that the model does not show the strength of the relationship, but only shows the relationship as strong or weak. Similarly, based on the proximity of nodes in social networks, a method for calculating relationship strength is proposed [7].
FS may also vary from friend to friend, and also depends on the situation/category. A person may have different groups of friends to work, and different groups of friends to play games or dine. FS increases through more interactions, and vice versa. In Singla [8], it was concluded that there is not only an association between users who use instant messaging to interact, but it also grows over time. In Pappalardo [9], another multidimensional importance of connection quality is recommended that abuses the presence of different associated shared associations among two people. They check the grouping on a multidimensional arrangement created upon clients in Facebook and Twitter, investigating the essential piece of strong and fragile associations, and associations with broadly perceived similarity strategies.
To show the strength of the relationship, an organized graphical model and independent learning are used. Therefore, customer intimacy, marking and correspondence are used [4]. In addition, four estimates of relationship strength are proposed in Granovetter [10]: joint effort, intimacy, energy, and duration of shared organization. Use FS to solve some special fascinating zones and the information between customers is integrated. Then, using the customer’s personal data and published information with the help of graphical models to evaluate the strength of the relationship [11]. Twitter’s enthusiast following relationship was used to create an association [12]. To evaluate the relationship strength, creators in De Choudhury [13] used email associations. More messages exchanged infer the closest relationship. Notwithstanding, in Liu [14] K-Means gathering and support vector computations are utilized to take a gander at the assessments in messages. In order to evaluate the emotions in blogs and texts, people are urged to establish a new framework that takes text documents and sentiment words as input, and generates sentiment classes as output [15].
Recommendation The recommender system recommends items related to the user’s search. These suggestions are not only made based on matched keywords, but information is also collected from the user’s search history. A lot of work has been done on the different proposals. Some researchers are dedicated to topic suggestions, and few types of research will recommend “additional friends” based on mutual friends, the same geographic area, or the same study/work organization. In Liu [16], by proposing a new heuristic similarity model, the user’s own ratings and user behavior are used to calculate the similarity.18 IASC, 2022, vol.32, no.1 In previous studies, contour formation trends are still common. Researchers use activity or like/dislike history to create a profile of a specific user, and then provide recommendations based on the profile. This kind of work established a user electronic file using tags, and then used these files for query development [3]. Similarly, user-generated tags are used to calculate the common interests of a group of users on the Delicious website data [17]. In addition, a recommendation system for flashing tags has been proposed, which uses the user’s tag history and geographic information to provide tag recommendations [18].
In order to provide users with suggestions, clusters of related users are generated [19]. Use the similarity measure “usefulness” to provide suggestions. Experiments were conducted using flicker, movielens and Last. fm. Content-based filtering and collaborative filtering for recommendations are combined using usergenerated content and relationships [20]. Calculate the link strength of users who use social circles and interactive information [21]. They also increase social services by proposing a link strength model. Use inspiring factors such as interests, social networking, and reputation to provide suggestions. Use the number of pictures shared between directly connected users to calculate inspiration [22].
The user’s interest is calculated through the interaction between them [23]. The system LAICOS provides a network search based on related tags and content tags to construct configuration files [24]. FS has been used to rearrange search results [25]. In order to illustrate the scores of users, user relationships based on location and mutual relationships in social networks are used [26], and user activities are used to calculate user interests. Activities are based on users’ social associations rather than documents [27]. In addition, the shortest path in social networks is proposed to establish a centrality measure [28].
Recommendations recommended by experts are called impact-based recommendations. These types of advice are mainly useful in the field of education. This system is proposed by a cooperative team (i.e., a group of expert knowledge personnel) to use their knowledge to make recommendations [29]. The ArnetMiner system is constructed by collecting data of researchers from the Internet. Using this system, related papers are recommended to users [30]. The PREMISE system uses expert information to provide recommendations. Experts are those who influence the press [31]. In Konstas [32], friendship information, tags, and play times are used to provide music recommendations through a random walk restart method.
Query Expansion
Few researchers have dedicated themselves to query suggestions. Different techniques have been used for query suggestion and query ranking. Attributes such as gender, age, and location are used to build models based on personalized rankings. This data is extracted from the configuration file of a real Microsoft account. The query suggestion is different from the query expression, because in the query suggestion it is suggested to propose a better query for the search process, while in the query expression, a new query is developed [33]. “Query expansion” is a technique widely used for query suggestions. The basic purpose of query expansion is to improve query suggestions. Query suggestions can also be realized by reordering queries [34]. Query suggestions and term weight responses are used to rearrange suggestions [35]. Using query suggestion methods can enhance the performance of search engines. They divide query suggestion methods into two categories, one is based on search results, and the second is based on log files. Both categories have their own advantages and disadvantages, which make them suitable for different queries. Commonly used similarity calculation techniques for search queries are the cosine similarity method and the Jaccard similarity method [36]. The two techniques are distinguished by comparing Jaccard and cosine methods [37].
Clustering has also been used in previous methods to cluster related queries. Then according to the keyword matching, the whole clustering proposal is put forward. The query log is also used to collect the searched queries. The query log not only provides searched queries, but also provides clicked links for specific queries. In Zahera [38], query recommendations based on the query clustering process have been proposed, which are collected from the log files of search engines. They not only cluster related queries, but also rank them based on similarity measures. Social media data is also used to construct query suggestions to build a circle of related people based on the suggested query. The social media attributes used for similarity measures are gender, city, and the same topic of discussion. Based on these attributes, a weight is provided for each user related to the search. The Jaccard similarity algorithm is further used to provide query ranking [39,40].
Query recommendations are also very important for children in the search process. In order to prevent children from finding irrelevant search results, it is important to only ask them reasonable and relevant queries. In this case, reference [41] proposed a query recommendation mechanism for children who use social media tags. This method can be used to improve search suggestions. They also proved that social media can play a very important role in advice and can replace traditional log-based advice methods.
The query used for search and the results selected from the search are also very effective for generating search suggestions. Based on the user’s previous research experience, a new query recommendation method is proposed. They suggested three utilities in the model. “Level utility” defines the user’s attractiveness to a specific query, “perceived utility” calculates the user’s actions on the search results, and the posterior utility calculates the user’s satisfaction with the selected results [42,43].
Query recommendations are provided from the query logs of search engines, similar to user queries. In addition, in order to personalize query suggestions, queries of users who have similar profiles to the current user can be suggested from the query log. It uses a similarity matrix to filter personalized results [39]. The bookmark data obtained from the social network is also used to generate query recommendations. According to the result retrieval based on the user’s query, the results are ranked using the user’s familiarity and similarity relationship [25]. On the label data, the top k queries are ranked based on the label/keyword input query. The algorithm uses the relationship strength and relevance of tags. Therefore, it incrementally provides the top k results including the most relevant queries [44]. In addition, query expansion is performed based on the similarity of the tags and the social similarity. Therefore, the relevant terms of the input query based on the above factors are sorted and appended to the query. It uses bookmark datasets for experimentation and comparison [45].
System Model
Fig. 1 shows the architecture of the proposed technology called “Personalized Retrieval from Social Media (PRISM)”. The flow of the architecture is as follows: Use Python scripts to extract datasets and annotations from Facebook. Then merge the two files to form a database. On the annotation file, perform preprocessing to remove irrelevant attributes. In the next step, FS will be calculated. The final database is further used in FS-based search engines. When the user types any word to be searched in the search box, the suggestion list will be displayed in a drop-down menu format. These suggestions change constantly as users type words or sentences. For the user’s query, a suggestion list containing the comments that the user’s friends have posted on his wall is retrieved.
Dataset
A python script was developed to extract the dataset from Facebook. As output, a data set containing more than 22k records was generated. The two types of attributes that can be used in the structure of the data set are important. The first is personal similarity, for example, the same group likes to join the same page, or the same like/dislike. The second is interaction similarity, which uses transaction information to calculate similarity. In this work, we use interaction similarity to calculate FS. There have been many jobs on FS, and its work is based on personal similarity. The basic properties of FS calculation in this work are:
- Likes count
- Comments count
- Tags count

These attributes are very effective for FS calculations. The number of likes shows the total number of likes of a specific friend on the user’s wall. You can like on pictures, achievements, emotions or any type of post. The number of comments includes the number of comments made by a specific friend on the user’s wall. Comments can also be written on any post or status. The third attribute is the tag count, which shows the number of times the user has been tagged. It can be any post, status, picture, location, or any feature that a user is tagged by a specific friend. All these attributes are used to calculate FS for each individual friend. The specifications of the data set are given in Tab. 1.
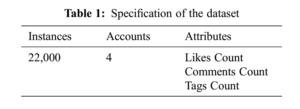
Crawling
We perform Crawling to extract data from Facebook. Therefore, the work of the data extraction process is shown in Fig. 2. When the script runs, the user is asked to enter Facebook’s unique ID/key. In the next step, the script will verify the Facebook key. If the input key is invalid, an error message will be displayed, otherwise the data extraction process will start. In the data extraction, the “friend’sID”, “friend’s name”, “like count”, “comment count” and “tag count” attributes will be obtained, and a comma-separated value (CSV) file will be obtained as the file containing the required data Output.
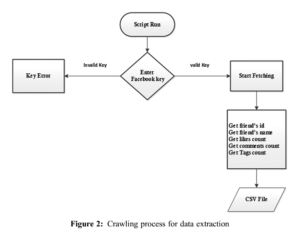
Friendship Strength Calculation The term “power of friendship” includes two parts: friendship and power. Friendship refers to the relationship between two people, and strength refers to the level of relationship between them. FS varies from friend to friend. As in real life, the level of our relationship with all our friends cannot be the same. Few of us are closer friends, and many are just formal friends. Similarly, we calculated the FS based on each friend of the user. The basic attributes calculated by FS are the number of likes, comments, and tags (photo tags, location tags, or any feature tags). Therefore, the sum of all these attributes can calculate the FS of the user and any of his friends, and the maximum degree of collaboration increases the level of the highest friendship. FS can be calculated as follows:
![]()
where FS refers to FS, LC account for likes count, CC means comments count and TC is tags count. For example, the friend “Ali” has a total of 32 likes on the user’s wall, which means Ali likes his 32 posts, including pictures, videos, achievements or any other posts. Similarly, “Ali” posted a total of 42 comments on all posts, pictures or achievements on the user’s wall. In addition, the number of tags is between “Ali” and the user, including 22 locations. According to the three attribute values, the FS of the user with “Ali” is 96.
Comments Extraction
The process of annotation extraction is shown in Fig. 3. When the script runs, the user is asked to enter a Facebook unique ID/key. If the key is invalid, an error message will be displayed, otherwise the data acquisition process will begin. The extracted data attributes include the ID of the post, the ID of the comment, the comment, the ID of the friend, the name of the friend, and the creation time of the comment. Some less important attributes are removed during the preprocessing stage. The important attributes in the acquired attributes are the ID of the comment, the comment, the ID of the friend, and the name of the friend. These attributes are also used to provide recommendations through the FS portfolio.
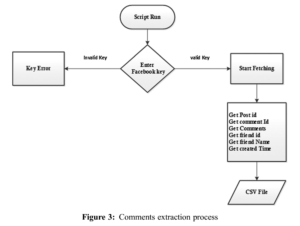
Comments Preprocessing
Preprocessing is the process of removing irrelevant attributes from the data set and retaining only the necessary attributes. Do this on both data set files to create the database used in the recommendation system. The data file contains the friend’s ID, friend name, like count, comment count, and tag count, while the comment file contains post ID, comment ID, comment, friend ID, friend’s name, and creation time. In the data file, the FS attribute is added. Later, the two files (i.e., the data file and the annotation f ile) were merged to form the final database.
Recommender System
The search engine has been developed on top of the database that is finalized by combining comments and FS attributes. The process of the search engine is given in Algorithm 1.
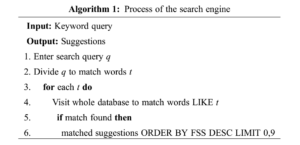

In Algorithm 1, the user enters a keyword query in the search engine (line 1). In the next step, divide the input query into words (line 2). In addition, every word in the query matches every word in the database (lines 3-4). It is recommended to print according to FS. Here, “DESC” is used to sort the suggestions in descending order relative to FS. The limit is 0.9 and is used to display a list of the top 10 suggestions in the output (line 5 and beyond). The information retrieval process is also shown in Fig. 4.
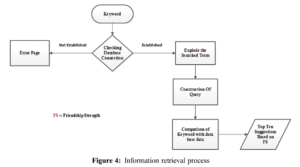
Suggestions
The output of the input query is a set of suggestions retrieved by the search engine. These are arranged according to FS. Therefore, the suggestions at the top of the list belong to the closest friends. In Fig. 5, the suggestions retrieved for the query “Allah” are described.
Experimental Evaluation
We have conducted experiments to evaluate the performance of the proposed technology PRISM. For experimentation, a search engine has been developed. In order to search for relevant data, the user types a query in the search box of a search engine. Therefore, suggestions are retrieved based on the input query. In order to describe the basic work of a search engine, Fig. 6 shows the suggestions of five friends for an input query. It only considers context-based retrieval without FS. The most relevant results were retrieved from the comments of “Saqib” and “Talha”, with a correlation of 100%. So, the relevance of “Kamar”‘s comments is 75%. The suggestions received from the comments of “Mudassar” are 60% relevant, while the comments of “Ali Naqvi” are 0% relevant.

When it comes to FS, a different retrieval order will be obtained, as shown in Fig. 7. Using similar queries for context-based retrieval (Fig. 6), including FS will produce different results. Obviously, the comments of “Mudassar” occupy the first place because “Mudassar” is a close friend. Similarly, the comment of “Talha” is in the second position. Here, “Ali Naqvi” ranks third on the basis of FS, but since his keyword similarity is 0%, there are no suggestions in his comments. The “Qamar” proposal is in the 4th place, and the “Saqib” proposal is in the 5th place.
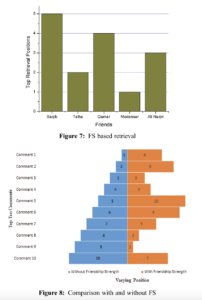
The comparison of the query results has been performed in Fig. 8. Here, the query “Noman Yousaf” is used to compare results based on FS and those without FS. It can be observed that when it comes to FS, the commentwill change its position in the suggestion. One suggestion ranks first in the absence of FS, and when considering FS, it is recommended to occupy a position among the first 6 suggestions. The top 9 positions without FS are in the top 9 positions with FS.
Parallel systems related to our proposed PRISM include query log, context merging, bookmark-based and personalized social query expansion (PSQE). We show here the comparison between the proposed PRISM and the parallel system. Fig. 9 shows the retrieval of suggestions from matching reviews without considering social similarity (or FS measure). The average result of ten queries with the same number of terms has been proven. Using the weighted Borda Fuse (WBF) algorithm, PSQE achieves the greatest accuracy (without FS measure), while PRISM achieves the second best accuracy. However, when we consider the FS measure, our system outperforms existing solutions (see Figs. 10 and 11). In contrast to context-based retrieval, social similarity-based retrieval provides personalized results. As shown in Fig. 10, PRISM showed better results compared to other parallel systems, while previously it provided 61% correlation results without using a similarity measure.
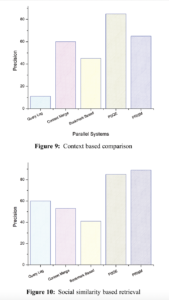
In Fig. 11, we demonstrate the effect of different numbers of terms in the input query. We consider using 0 to 10 terms to track the results. It can be observed that when the number of items is the smallest, mostIASC, 2022, vol.32, no.1 27 systems provide better results. The accuracy decreases as the term increases. With existing systems, PSQE can produce good results. In contrast, PRISM can obtain the highest accuracy with FS.
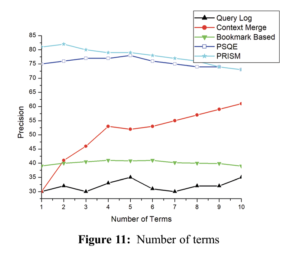
In Fig. 13, the results were produced without social measures. Compared with Fig. 12, when PSQE provides 70% accuracy and PRISM achieves 67% accuracy, the correlation of the results is reduced. It can be inferred that social measures increase the relevance of the search.
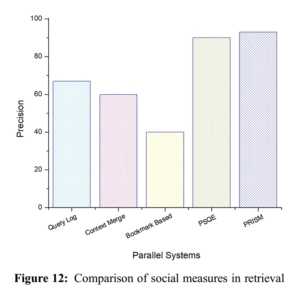
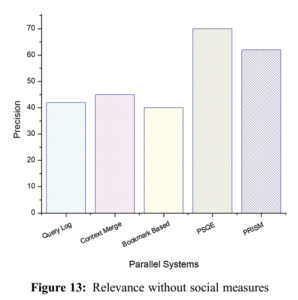
Conclusion
This paper proposes a new query recommendation technology. It uses FS to rank queries. A query suggestion algorithm based on social media comments has been developed. Based on this algorithm, a recommender system is constructed to provide suggestions based on FS. The Facebook dataset has been constructed and used for experiments. By using the data set, a comparative analysis with the parallel system has been performed. The proposed system PRISM can provide about 85% accuracy. The accuracy of PSQE is about 80%, second only to the comparison system. Therefore, the accuracy of PRISM has been significantly improved. In the future, the FS-based recommendations can be improved by adopting the actual search queries of the research team. In addition, the query log can be used to collect queries, and surveys can be conducted from users to find the level of satisfaction regarding recommendations.

AI In Shipping: Areas To Watch In 2024
Editor’s note: This is a re-post of an article from ship-technology.com
The buzz around artificial intelligence continues to proliferate, with shipping companies beginning to explore AI’s potential in predictive maintenance, intelligent scheduling and real-time analytics. Here is a round-up of five specific areas set to benefit from artificial intelligence in 2020.
Automated processes at shipping terminals
The shipping industry is growing in confidence at AI technology’s capacity to run processes at container terminals and expects it to play a big role in operations in the near future.
In a survey by Navis, 83% of respondents expect to increase their investment in AI technologies within the next three years. A large proportion of participants also agreed that AI could be involved in automating processes at terminals, such as container handling equipment assignments (81%), decking systems (81%), recommended actions (69%), predicting gate volumes (59%), and stowage of vessels (52%).
Approximately 56% said they were either trialling technologies or carrying out research into AI capabilities. However, there is some way to go yet as just 11% confirmed they were already using AI in some capacity in terminal operations.
As for what they anticipate the biggest challenge to be with AI, 68% stated that it was a lack of skills in the technology. While around a third said there was a lack of cases that had proven the advantages for business. But as the technology is still relatively new, this is hardly surprising.
Although the survey asked a relatively small pool of 60 Navis customers, this can be taken as an indication that the industry is giving serious consideration to what AI has to offer.
In a separate development, Kawasaki Kisen Kaisha (K Line) has started a project to research into AI’s capabilities to improve the quality of shipping services. The research is being carried out in collaboration with fellow Japanese organisations Hiroshima University, Marubeni Corporation and the National Institute of Maritime, Port and Aviation Technology (MPAT). The project will use predictive models for maritime logistics and market conditions.
Reducing fuel consumption

Next year, Stena Line is rolling out an AI platform to cut fuel consumption on its fleet of ships.
Since 2018, the company has been experimenting with AI tech on the Stena Scandinavica ferry, which travels overnight from Gothenburg in Sweden to Kiel, north Germany. The company has been collaborating on this project with tech firm Hitachi.
These tests have proven that the platform can provide fuel savings of up to 3%.
The Stena Fuel Pilot AI software is able to predict the most economical route in terms of fuel consumption. Factors such as weather, currents, and other variations potential problems are taken into account and then the most efficient route is recommended.
The company has a set a target of cutting fuel consumption and carbon emissions by 2.5% per annum. Of Stena’s total running costs, 20% is spent on fuel. By the end of 2020, Stena Line plans to install the AI software on 38 of its vessels throughout Europe.
One of the most complex factors to predict is water currents, which Stena hopes to make possible by refining the AI technology. Stena’s ultimate ambition for AI is to create a system so precise that the captain can use it to plan routes in total confidence.
Stena Line aims to be fully AI-assisted in 2021. Areas where the company is already being supported by AI include administration, customer service and finance.
Image recognition systems
AI is being used for ship image recognition systems as part of a collaboration between Chinese tech company SenseTime and Japanese shipping firm Mitsui OSK Lines (MOL).SenseTime’s system uses ultra-high-resolution cameras and a graphic processing unit (GPU) to automatically identify vessels in the surrounding area. It is intended to help improve safety and help stop large vessels colliding with smaller ones. It can also provide alerts to other hazards, particularly when visibility is poor. The image recognition technology could be used to monitor shipping lanes, as well as for security and coastguard operations.
The Chinese company developed the graphic recognition engine by combining AI deep-learning technology with MOL’s extensive maritime experience. The system automatically collects image data, which MOL intends to use to refine the precision of the technology.
The system has been tested this year onboard MOL’s passenger line cruise ship, Nippon Maru. MOL plans to try the solution on other vessels as the company explores the development of autonomous smart ships.
SenseTime is currently one of the world’s leading AI start-ups. Previously, the company teamed up with Honda to develop self-driving cars. However, SenseTime’s products are unlikely to be launched in the US any time soon. The start-up has been added to the US Government’s Entity List due to national security concerns, amid the Trump administration’s trade war with China.
Navigation systems
Navigation is one obvious area with potential for AI use in shipping and a number of systems are currently in development. Some use elements of image recognition and tracking software, alongside IoT connectivity. AI can be used to analyse multiple navigation scenarios.
Orca AI is one such AI navigation platform being developed. The company’s solution combines sensors and cameras with deep learning algorithms. It is able to locate and track other vessels on the water and take action to avoid collisions.
Meanwhile, Wärtsilä subsidiary Transas’ Navi-Planner is an AI platform that uses machine learning to optimise voyage planning. Safe navigation routes are automatically created according to the latest charts and environmental information available. It records any near-misses and other incidents that occur during voyages. The system will also be able to adjust routes and speeds to ensure arrivals take place on schedule.
Not surprisingly given its heavy focus on AI, Stena Line has also developed its AI Captain solution for ship navigation. It is able to recalculate routes during voyages when it receives information to say there is an issue with the present route.
Unmanned vessels

Perhaps the ultimate goal for artificial intelligence in shipping is to enable vessels to operate unmanned. This is expected to take a leap forward in 2020.
In September, the Mayflower Autonomous Ship (MAS) will leave Plymouth in the UK and head across the Atlantic to Massachusetts, US. It will be a very similar route to the one taken in 1620 by the first European settlers in the US, exactly 400 years previously.
The difference this time is that there will be no crew onboard, with tech making decisions on route planning and hazard avoidance. The trimaran vessel will use equipment such as radar, GPS, cameras, satellites, sensors and LIDAR for the voyage, with AI systems provided by IBM. A deep-learning system will enable data gathering and analysis during the voyage.
In case of an emergency, the ship can make a satellite call back to the UK for assistance. MAS will get its power from solar and wind, with a diesel engine for backup.
Elsewhere in the industry, Yara Birkeland is an automated container ship being developed by Kongsberg and Yara. It is also fully electric.
Yet one of the biggest issues with automated ships is economics. The sheer amount of tech required for a fully automated container ship isn’t going come cheap. The Yara Birkeland is estimated to cost around $25m, which is three times higher than a container vessel of equivalent size. Furthermore, with no-one on board, it could make them a target for opportunist pirates.

Top Cyber Security Threats That Businesses Face and How to Avoid Them
Digital transformation has revolutionized business processes without compromising data security. However, this comes with a list of common digital security risks. With human errors responsible for 95% of cyber security challenges, companies must stay vigilant and incorporate new strategies to resolve IT security concerns for businesses. So, let’s find out the top cybersecurity threats that you must overcome to safeguard your company’s data.
What are the emerging cyber risks in 2024?
From ransomware and phishing attacks to advanced persistent threats (APT), there are various types of threats to information security in 2024. So, let’s dive deep into the issues in cyber security you need to watch out for.
Ransomware
Ransomware is a form of malware that can compromise your data security. It is often spread through downloads, emails, or other types of vulnerabilities that can be found in outdated applications or software. Once it infects a system, it can block access to data stored on the computer system or threaten to publish it without the owner's consent. Besides, it can take many different forms, including locking users out of their systems or encrypting their files so they can no longer be accessed.
Cybersecurity risks affect all businesses. They can cause a great deal of financial loss to its victims where ransomware attackers may demand a hefty ransom fee within a specific deadline, typically paid in cryptocurrency such as Bitcoin. Payment of ransom does not guarantee that the victim's data will be restored. Sometimes, attackers take the ransom and run. Besides, there is no guarantee that the attacker will get in touch with the victims to demand a higher ransom fee.
If the victim fails to pay the ransom on time, it can lead to permanent data loss. In some cases, ransomware attackers may even threaten to leak the stolen data to the public or use it for other malicious activities.
To protect your organization against ransomware, you must follow these cybersecurity practices:
- Implement network segmentation
- Limit user access privileges
- Regularly update your software and systems
Advanced Persistent Threats (APT)
One of the most common problems with cyber security includes advanced persistent threats (APT). It is a form of a cybersecurity attack campaign that involves an intruder or a group of well-funded attackers accessing confidential data. Often, the victims of APT include government networks, critical infrastructure companies, or large enterprises. These attacks are developed using various methodologies by highly skilled experts; hence, they remain undetected for a long time until they cause damage to the entire network.
Apart from traffic monitoring, here are the most effective defences against APTs:
- Monitor traffic, user, and entity behaviour
- Filter unwanted emails to the spam folder
- Implement access control policies for authentication and authorization
Phishing and Spear Phishing
Phishing is a type of cybersecurity issue where an attacker masquerades as a trusted party to coerce the victim into viewing a file or link attached to an email, text message, or even an instant message. Its main objective is to steal user data, such as credit card details and login credentials. Sometimes, the attacker may threaten their victims to create a sense of urgency to provide the required information as soon as possible.
Spear phishing is a form of phishing attack that can cause various issues in cybersecurity. It is carried out after conducting thorough research about the victim; hence, it works as an effective way to persuade the victim into taking a desired step. It can take the form of a personalized email that includes all the details relevant to a specific business, organization, or individual for malicious purposes.
Cyber security threats, such as phishing and spear phishing can be avoided using our tried and tested measures listed below:
- Update your systems using the latest security patches
- Install firewalls
- Use Domain-based Message Authentication, Reporting & Conformance (DMARC) technology
- Encrypt sensitive information
Supply Chain Attacks
In today’s world, supply chain attacks are one of the biggest cybersecurity threats. They occur when an attacker, disguised as a third-party partner or vendor, gains access to a company's data or systems. These attacks can be quite challenging for most companies to detect because they benefit from their victims’ trust in their suppliers or partners. Often, these attacks are carried out through malicious software or code that is included in software or application updates. This allows attackers to gain access to sensitive data or systems and carry out their malicious activities.
Supply chain attacks can be controlled using the following techniques:
- Implement honeytokens
- Implement a Zero Trust Architecture (ZTA)
- Minimize access to critical data
- Enable multifactor authentication
Insider Threats
One of the most common threats to information security includes insider threats. Insider threats originate from within an organization where the attacker can be a vendor, contractor, partner, or current or former employee of the company. Since insiders have access to the organization’s critical data, they can threaten the confidentiality, integrity, and availability of enterprise data and systems.
The effects of a successful insider threat can be detrimental to businesses. Therefore, organizations must protect their confidential data, systems, networks, people, and facilities. Access to the information should be limited to trusted employees and background checks should be conducted on new hires. In addition to this, the following tips can help prevent insider threats:
- Monitor user activity
- Create security awareness through regular training
- Implement comprehensive security policies with guidelines for handling insider misuse
Tips to Prevent the Greatest IT Security Concerns
IT service company Mobiz Inc. has partnered with Palo Alto to protect data and systems from cyber security risks for businesses of all sizes. It offers real-time threat detection and helps prevent cybersecurity threats by providing comprehensive and scalable solutions. Our team of cybersecurity experts will handle your cybersecurity needs, reduce downtime, and improve network performance.
To avoid the risk of cybersecurity issues, there are some effective tips to follow:
- Ensure that your device remains up-to-date.
- Refrain from viewing unknown websites or links shared by compromised accounts.
- Use VPN while connected to public Wi-Fi networks.
- Partners and vendors associated with an organization should adhere to strict security protocols and standards, such as SOC 2 compliance.
In addition to these preventative measures, you can count on IT service company Mobiz inc for IT solutions for your business. It offers cyber security services, including incident management to identify and resolve cyber security threats for small businesses and large enterprises. This will not only prevent systems from the biggest threat to cyber security but also from communicating with malicious commands.

Determining the Scope Of An IT Project
Technology solves many business issues, make sure you have the right IT consultant for the job.
How to Define the Scope of Your IT Project
Customized software development means juggling many responsibilities such as:
- Setting goals and milestones
- Identifying the right resources for each task
- Determining project requirements
- Managing change
- Performing a needs assessment
Successful IT project management is the culmination of implementing the right best practices with the art of time management. Knowing the scope of your project is a critical step and it all starts with a thorough IT environment assessment. Whether your project is an office move, a structured cabling job, a cloud migration, or a customized inventory management platform, knowledge is key. Armed with information, you can determine the scope of the project by answering the following:
- What are the requirements? This determines what features and functions are required. What needs to be specifically built into the solution?
- What are the process requirements? Not only is it important for the solution to function a certain way on its own, but the scope will touch on existing processes as well. Data is never static, it flows from one point to another.
- Who are the stakeholders? People are as important to the solution as the solution itself. When important stakeholders are left out of the development process, it may be impossible for them to buy in once the solution is finished.
- What are the limitations? Scope isn’t all about what is included, it is about what needs to be excluded as well. Often it is important to document what will not be done to better define expectations.
- How will change be managed? Once scope is defined, it can’t be changed without the right change management functions taking place. The time to define how change will be handled is at the very beginning
MOBIZ will make sure you have the right answers to these questions so your project gets off on the right start. But what if you already have an IT provider? In some cases, your managed service provider may be more of an impediment than a vehicle for success.
When Custom Software Development Is Beyond the Scope of Your Managed MSP
Defining the scope of your IT project is critical because one of the main determining factors to success is having the right people and resources available. If you are using a managed services provider they simply might not be equipped to handle your project.
Most MSP’s Simply Maintain a Baseline of Support
Managed service providers are usually doing two things, monitoring infrastructure such as email servers, workstations, patching, and networks, and incident remediation like responding to outages and cyber attacks. An MSP that has actual programmers on staff is a rare thing which means if something comes up with a client they are usually forced to find another option
Managed Service Providers Will Suggest Their Own Provider
When presented with a high-level It project, an MSP may understand the solution but not have the resources to carry it out. This is very common for projects like structured cabling and web design. While the MSP may handle some low-level tasks, anything that is part of a large project is usually left to a third party.
Specialized Solutions Require a Specialized Provider
When you have an IT project, there is no need to rely on options that fall short. MOBIZ is the specialized It provider your business needs to make sure your IT project has the best chance of success.
AT MOBIZ, we’re here to help you tackle the big-picture tasks. Whether you want to upgrade your servers, tighten network security, or move your data to the cloud, large IT projects require a business to invest time and capital in the management of these projects. MOBIZ can create a roadmap and strategy for delivering critical projects properly and without any disruption to your day-to-day IT operations.